11.3 Corpus
Corpus is a collection of written texts, especially the entire works of a particular author or a body of writing on a particular subject. Corpora are generally used for statsitical liguistic analysis and hypothesis testing (Mayo 2017). Let’s look at our data set for the capstone which can be found here. Below is our code to summarize our data set.
## Download file (run at the beginning only) ---------

# if (!file.exists("data")) {
#  dir.create("data")
#}
# download.file(
#  "https://d396qusza40orc.cloudfront.net/ds scapstone/dataset/Coursera-SwiftKey.zip",
#  destfile = "./data/Coursera-SwiftKey.zip"
# )
# unzip("./data/Coursera-SwiftKey.zip", exdir = "./data")

## Combining -----------
files2 <- list.dirs("./data/final")
lsfile <-  paste0(files2[2:5],"/",
                  list.files(files2[2:5]))

# gives us a list of directory paths to the actual text file
ldir <- normalizePath(files2[2:5], "rb")

# gives us full path and filename
finaldir <- dir(path=ldir, full.names=TRUE)

## Build a table --------------

## Num_Words total number of words in a txt file
Num_Words <- vector("numeric")

## Num_Lines number of lines per txt file
Num_Lines <- vector("numeric")

## Range of words per line
Min_Words <- vector("numeric")
Mean_Words <- vector("numeric")
Max_Words <- vector("numeric")
for (i in 1:12) {
      Num_Words[i] <-
        print(sum(stri_count_words(readLines(finaldir[[i]]))))
      Mean_Words[i] <-
        print(round(mean(stri_count_words(
          readLines(finaldir[[i]])
        ))), digits = 2)
      Min_Words[i] <-
        print(round(min(stri_count_words(
          readLines(finaldir[[i]])
        ))), digits = 2)
      Max_Words[i] <-
        print(round(max(stri_count_words(
          readLines(finaldir[[i]])
        ))), digits = 2)
      Num_Lines[i] <- print(length(readLines(finaldir[i])))
}

# Table -------------
list_files <- tibble(
        'Name' = list.files(files2[2:5]),
        'Size_MB' = round(file.size(finaldir) / 10 ^ 6, digits =
                            2),
        Lines = Num_Lines,
        Words = Num_Words,
        Min = Min_Words,
        Average = Mean_Words,
        Max = Max_Words
)
# knit to table -----------
kable(list_files, caption = 'Corpus-Collection of Text',
align = c(rep('c', times = 5))) %>%
kableExtra::kable_styling()| Name | Size_MB | Lines | Words | Min | Average | Max |
|---|---|---|---|---|---|---|
| de_DE.blogs.txt | 85.46 | 371440 | 12682659 | 0 | 34 | 1638 |
| de_DE.news.txt | 95.59 | 244743 | 13375092 | 1 | 55 | 603 |
| de_DE.twitter.txt | 75.58 | 947774 | 11646033 | 0 | 12 | 42 |
| en_US.blogs.txt | 210.16 | 899288 | 37546250 | 0 | 42 | 6726 |
| en_US.news.txt | 205.81 | 1010242 | 34762395 | 1 | 34 | 1796 |
| en_US.twitter.txt | 167.11 | 2360148 | 30093372 | 1 | 13 | 47 |
| fi_FI.blogs.txt | 108.50 | 439785 | 12785318 | 0 | 29 | 2353 |
| fi_FI.news.txt | 94.23 | 485758 | 10532432 | 1 | 22 | 478 |
| fi_FI.twitter.txt | 25.33 | 285214 | 3147083 | 1 | 11 | 44 |
| ru_RU.blogs.txt | 116.86 | 337100 | 9388482 | 1 | 28 | 1197 |
| ru_RU.news.txt | 119.00 | 196360 | 9057248 | 1 | 46 | 1581 |
| ru_RU.twitter.txt | 105.18 | 881414 | 9231328 | 1 | 10 | 36 |
Table 1.1: Corpus-Collection of Text, summarizes our 12 collections into their respective name files, size in mb, number of lines, number of words and their summary from minimum, average and max words per line. . The data sets have a collection of 4 languages compose of blogs, news, and twitter. The languages are in German, English, Finnish, and Russian. All characters are based on roman characters and in several cases I saw several emoji character inside twitter text collections.
Let us visualize the File Name into Size_MB, Lines, and Words.
list_files %>% ggplot(aes(x=reorder(Name, -Size_MB),
                          y=Size_MB)) +
                  geom_col() +
                  theme(axis.text.x=element_text(angle=90,hjust=.1)) +
labs(x= "File Name", y= "File Size (mb)", title = "File Name and Size (mb)") 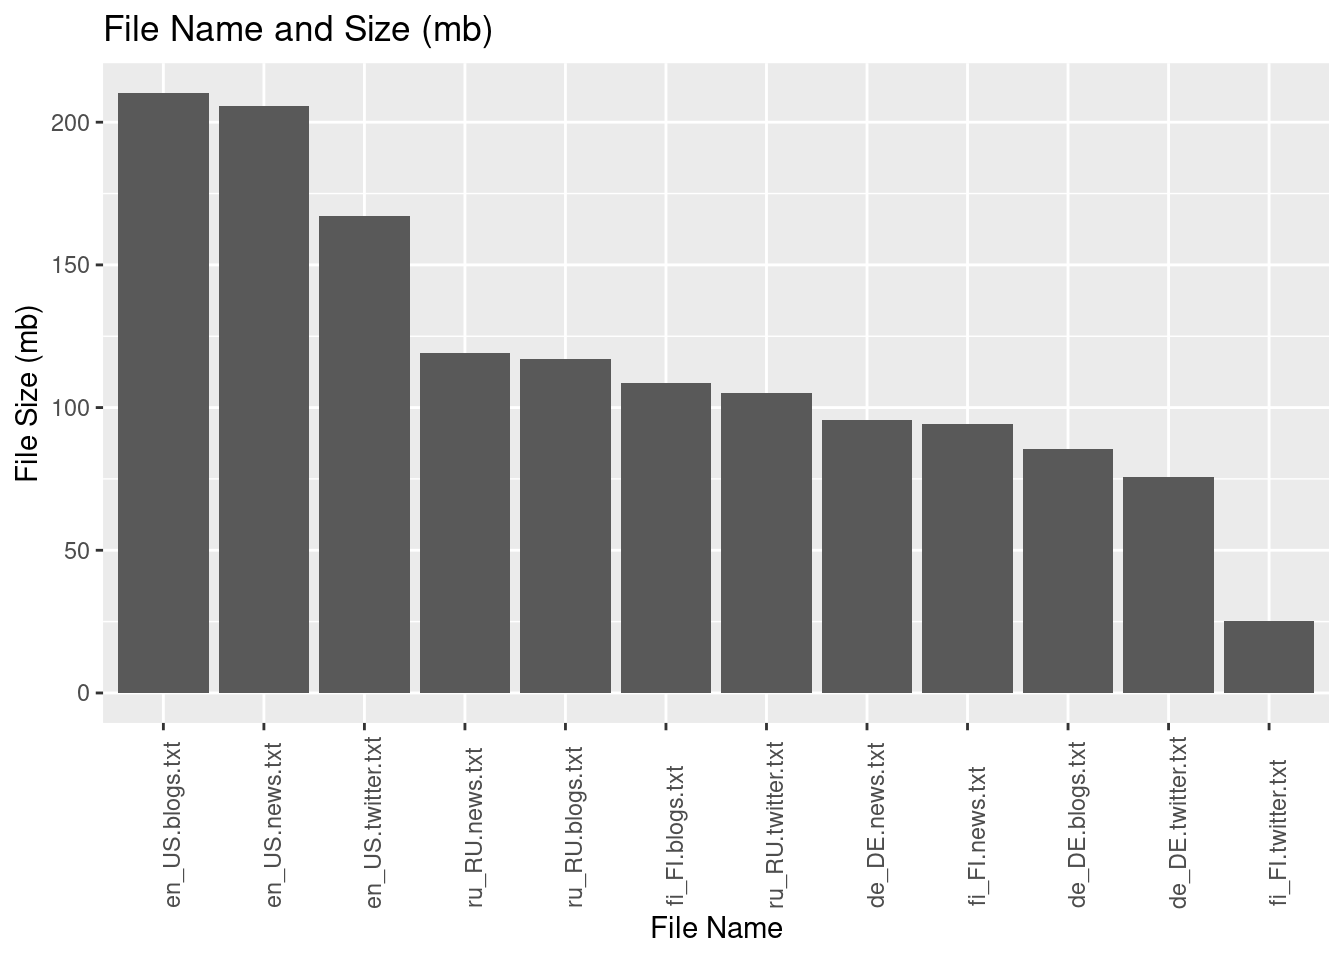
Number of lines:
list_files %>% ggplot(aes(x=reorder(Name, -Lines),
                          y=Lines)) +
                  geom_col() +
                  theme(axis.text.x=element_text(angle=90,hjust=.1)) +
labs(x= "File Name", y= "Number of Lines", title = "Number of Lines per File") 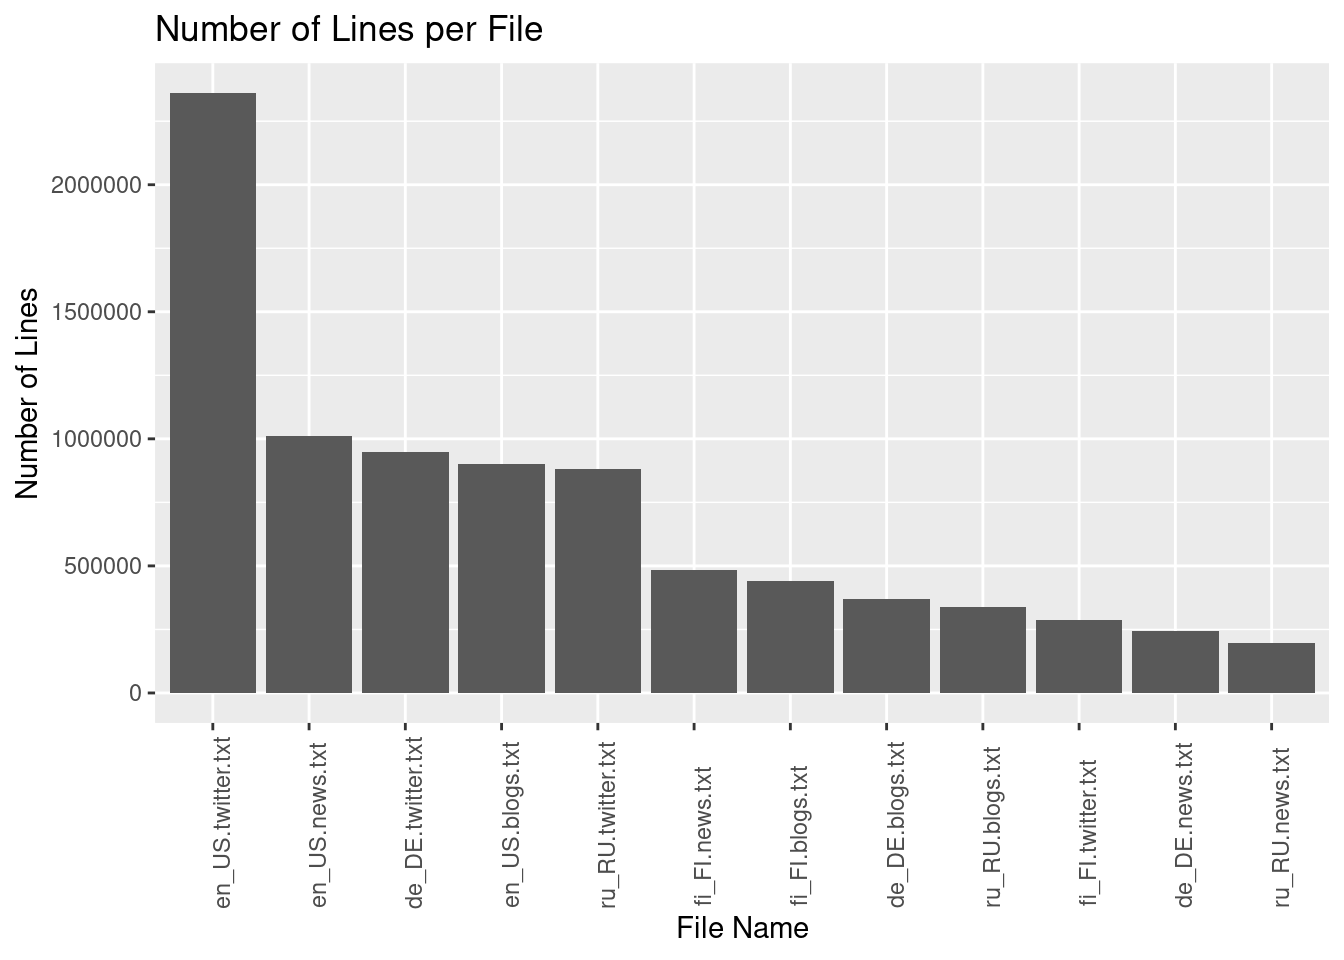
Number of Words:
list_files %>% ggplot(aes(x=reorder(Name, -Words),
                          y=Words)) +
                  geom_col() +
                  theme(axis.text.x=element_text(angle=90,hjust=.1)) +
labs(x= "File Name", y= "Number of Words", title = "Number of Words per File") 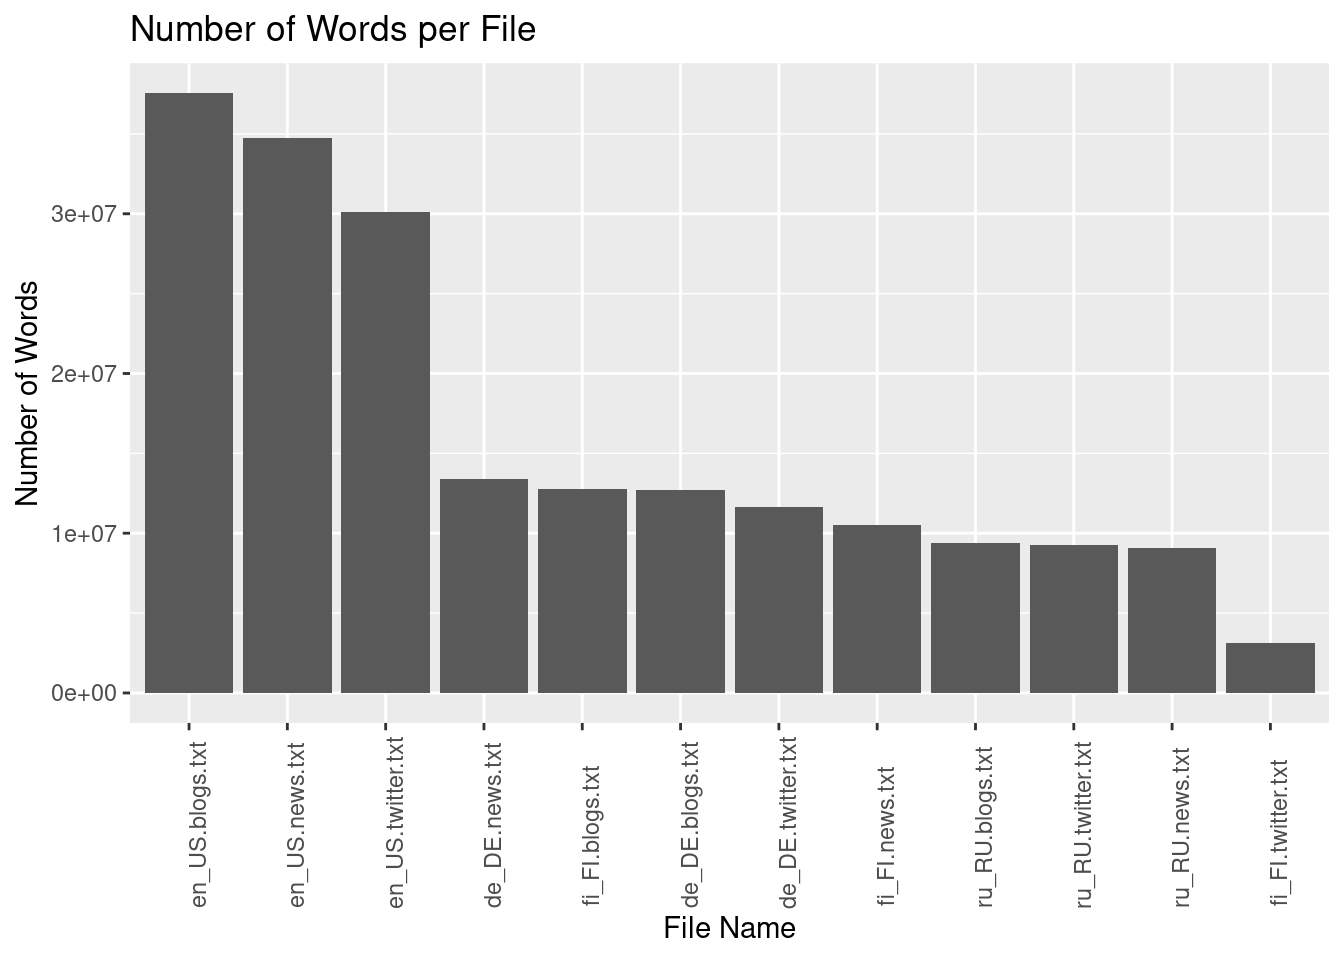
References
Mayo, Matthew. 2017. “Building a Wikipedia Text Corpus for Natural Language Processing.” https://www.kdnuggets.com/2017/11/building-wikipedia-text-corpus-nlp.html#:~:text=In%20linguistics%20and%20NLP%2C%20corpus,of%20corpus)%20may%20be%20useful.